Schedule screen
Schedule
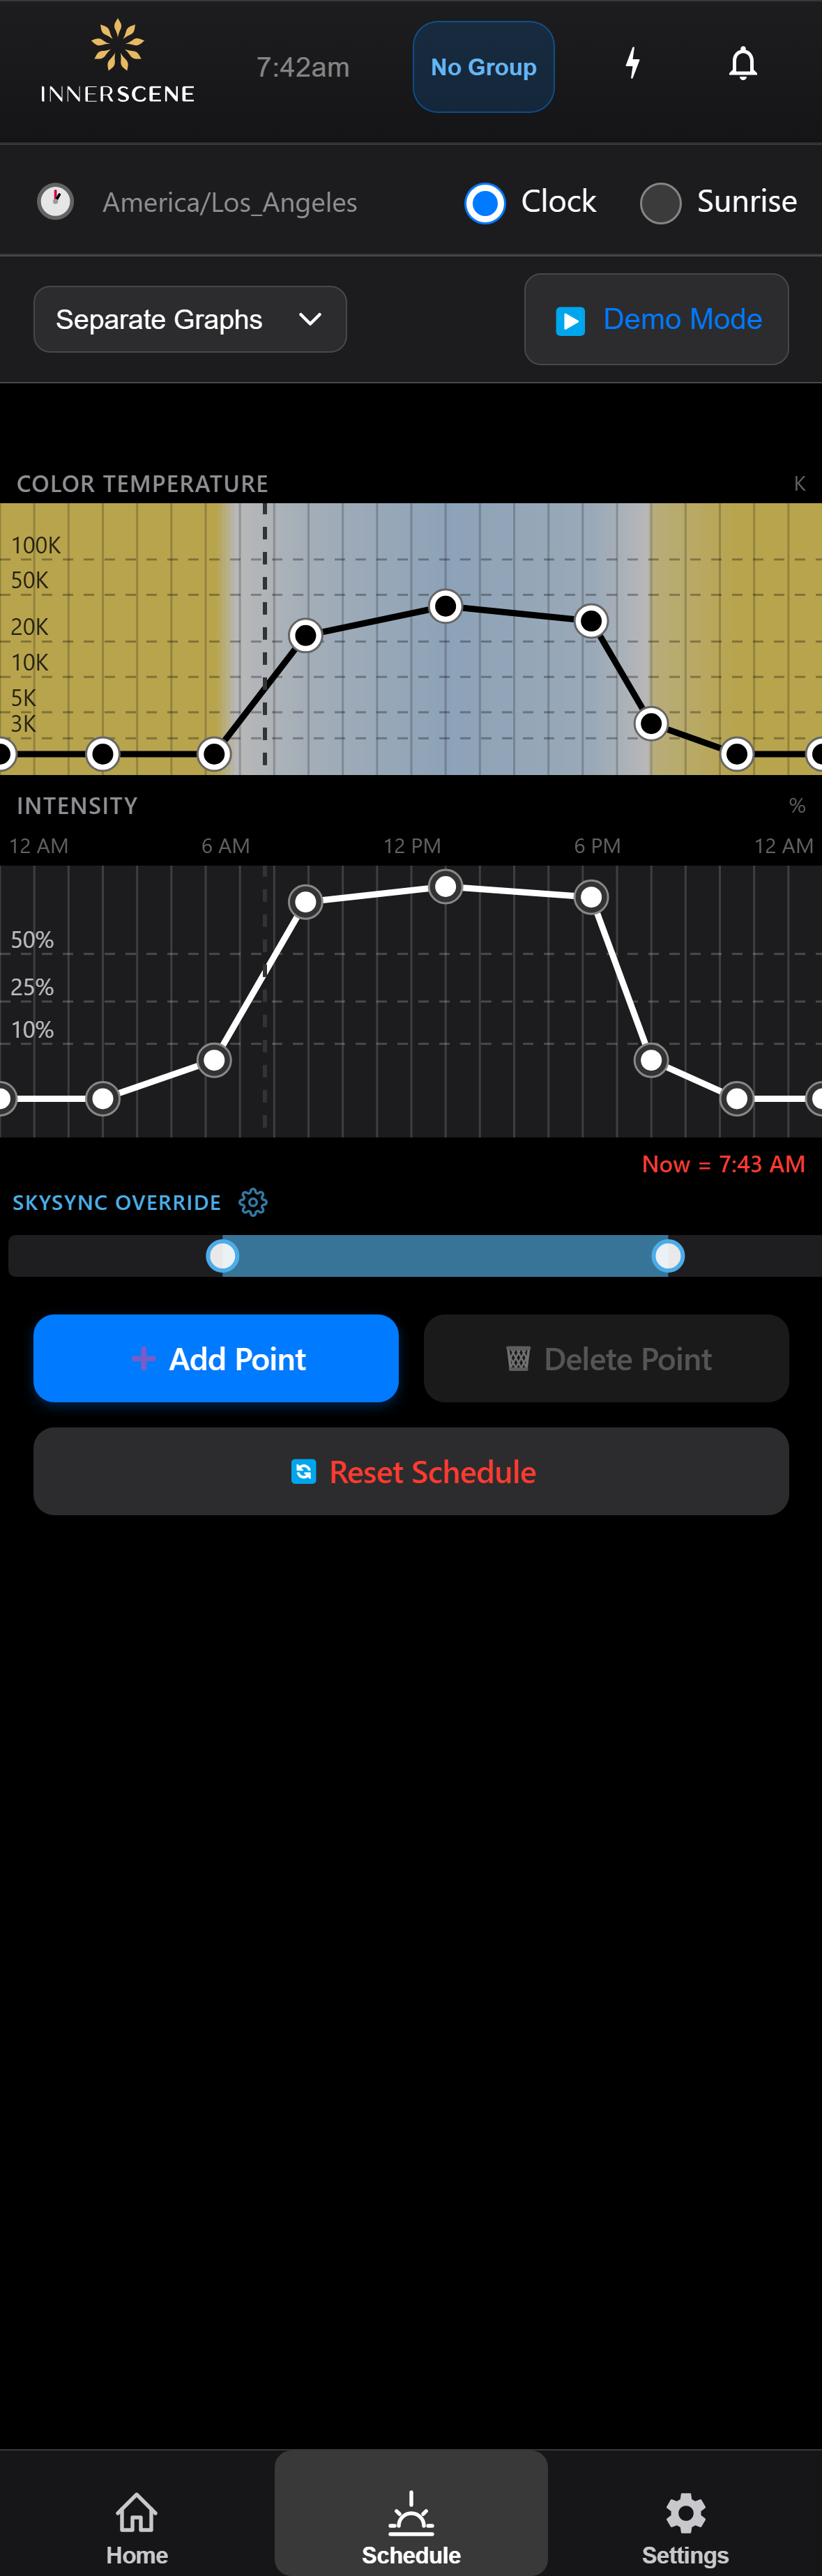
Create and edit the daily lighting schedule. The interactive graph shows color temperature and brightness throughout the day with draggable control points.
Controls on this screen
- View Mode
Switch between Graph View (visual timeline with draggable points) and List View (table of all schedule points with exact values). Both views edit the same schedule.
- Graph View (default) Visual interactive timeline. Drag points to adjust time and brightness. Long-press to edit CCT. Shows the schedule as a filled curve with the current time indicator.
- List View Table of all schedule points with exact numeric values for time, brightness, and CCT. Easier for precise editing and seeing all points at once.
- Demo Mode
Plays through the entire day's schedule in fast-forward on the physical fixture. Useful for previewing how the light will change throughout the day. The demo timeline indicator moves across the graph as it plays.
- Color Temperature Graph
Top graph showing how color temperature (in Kelvin) changes across a 24-hour day. Each schedule point appears as a draggable dot on the curve. Tap a point to select it (this also selects the matching point in the Intensity graph below). Once selected, drag up or down to change its color temperature, or drag left or right to shift its time of day. Press and hold a selected point to open the edit dialog for exact entry of time, CCT, and intensity. Tap empty space to deselect.
- Intensity Graph
Bottom graph showing how brightness (0 to 100%) changes across the same 24-hour day. Each dot is the same schedule entry shown in the Color Temperature graph above, so selecting a point here also selects it there. Drag a selected point up or down to change brightness, or left or right to shift its time. Press and hold to open the edit dialog. A vertical "Now" line marks the current time, and a green line appears while Demo Mode is previewing the day.
- Current Time Indicator
Vertical dashed line marking the current clock time. The line crosses both the Color Temperature graph and the Intensity graph at the same x-position so you can see at a glance what CCT and brightness the schedule is targeting right now. The matching "Now = HH:MM" label appears below the Intensity graph. Line and label slide from left to right as the day progresses. While Demo Mode is previewing the day, a separate green line moves at fast-forward speed alongside this one.
- SkySync Override Bar
Horizontal bar below the graphs that defines the time-of-day window during which a paired SkySync outdoor sensor is allowed to override the schedule. Two draggable handles set the start and end of the window (the shaded region between them). Drag either handle left or right to change that time, a tooltip shows the exact value while you drag. The handles can wrap past midnight, in which case the window spans from the start time through to the end time the following morning. Tap the bar (a short tap with no drag) to toggle between two modes: "SkySync Override" (uses the time window between the handles, label shown here) and "SkySync Always Active" (no time restriction, SkySync controls the fixture whenever the sensor has valid data). When SkySync is inside the active window it takes over and aligns the indoor light to outdoor conditions. Outside the window, or when the sensor is offline or reads too little light, the regular schedule controls the fixture and a status line below the bar explains which fallback is active. The gear icon next to the label opens the [[skysync_settings|SkySync Settings]] page for sensor pairing and tuning.
- Schedule Graph
Combined view of the same 24-hour schedule, available when View Mode is set to "Combined Graph". The upper filled area represents brightness (0-100%) and the colored line represents color temperature. Tap a point to select it, then drag to adjust time and brightness. Press and hold a selected point to open the edit dialog. A "Now" indicator shows the current time.
- Add Point
Adds a new schedule control point. The point is placed at the current time with default values. You can then drag it to the desired position or tap to edit its values precisely.
- Reset Schedule
Replaces the current schedule with Innerscene's default circadian curve (seven points from 2,200 K at midnight, ramping up through 5,500 K at noon, back down to 2,200 K at end of day). You are prompted to confirm before the reset runs, and the previous schedule is saved so you can use Undo to restore it.
Open this screen in the interactive guide to explore it with clickable callouts, search, and a live simulator, or browse all screens.