Advanced screen
Calibration Results
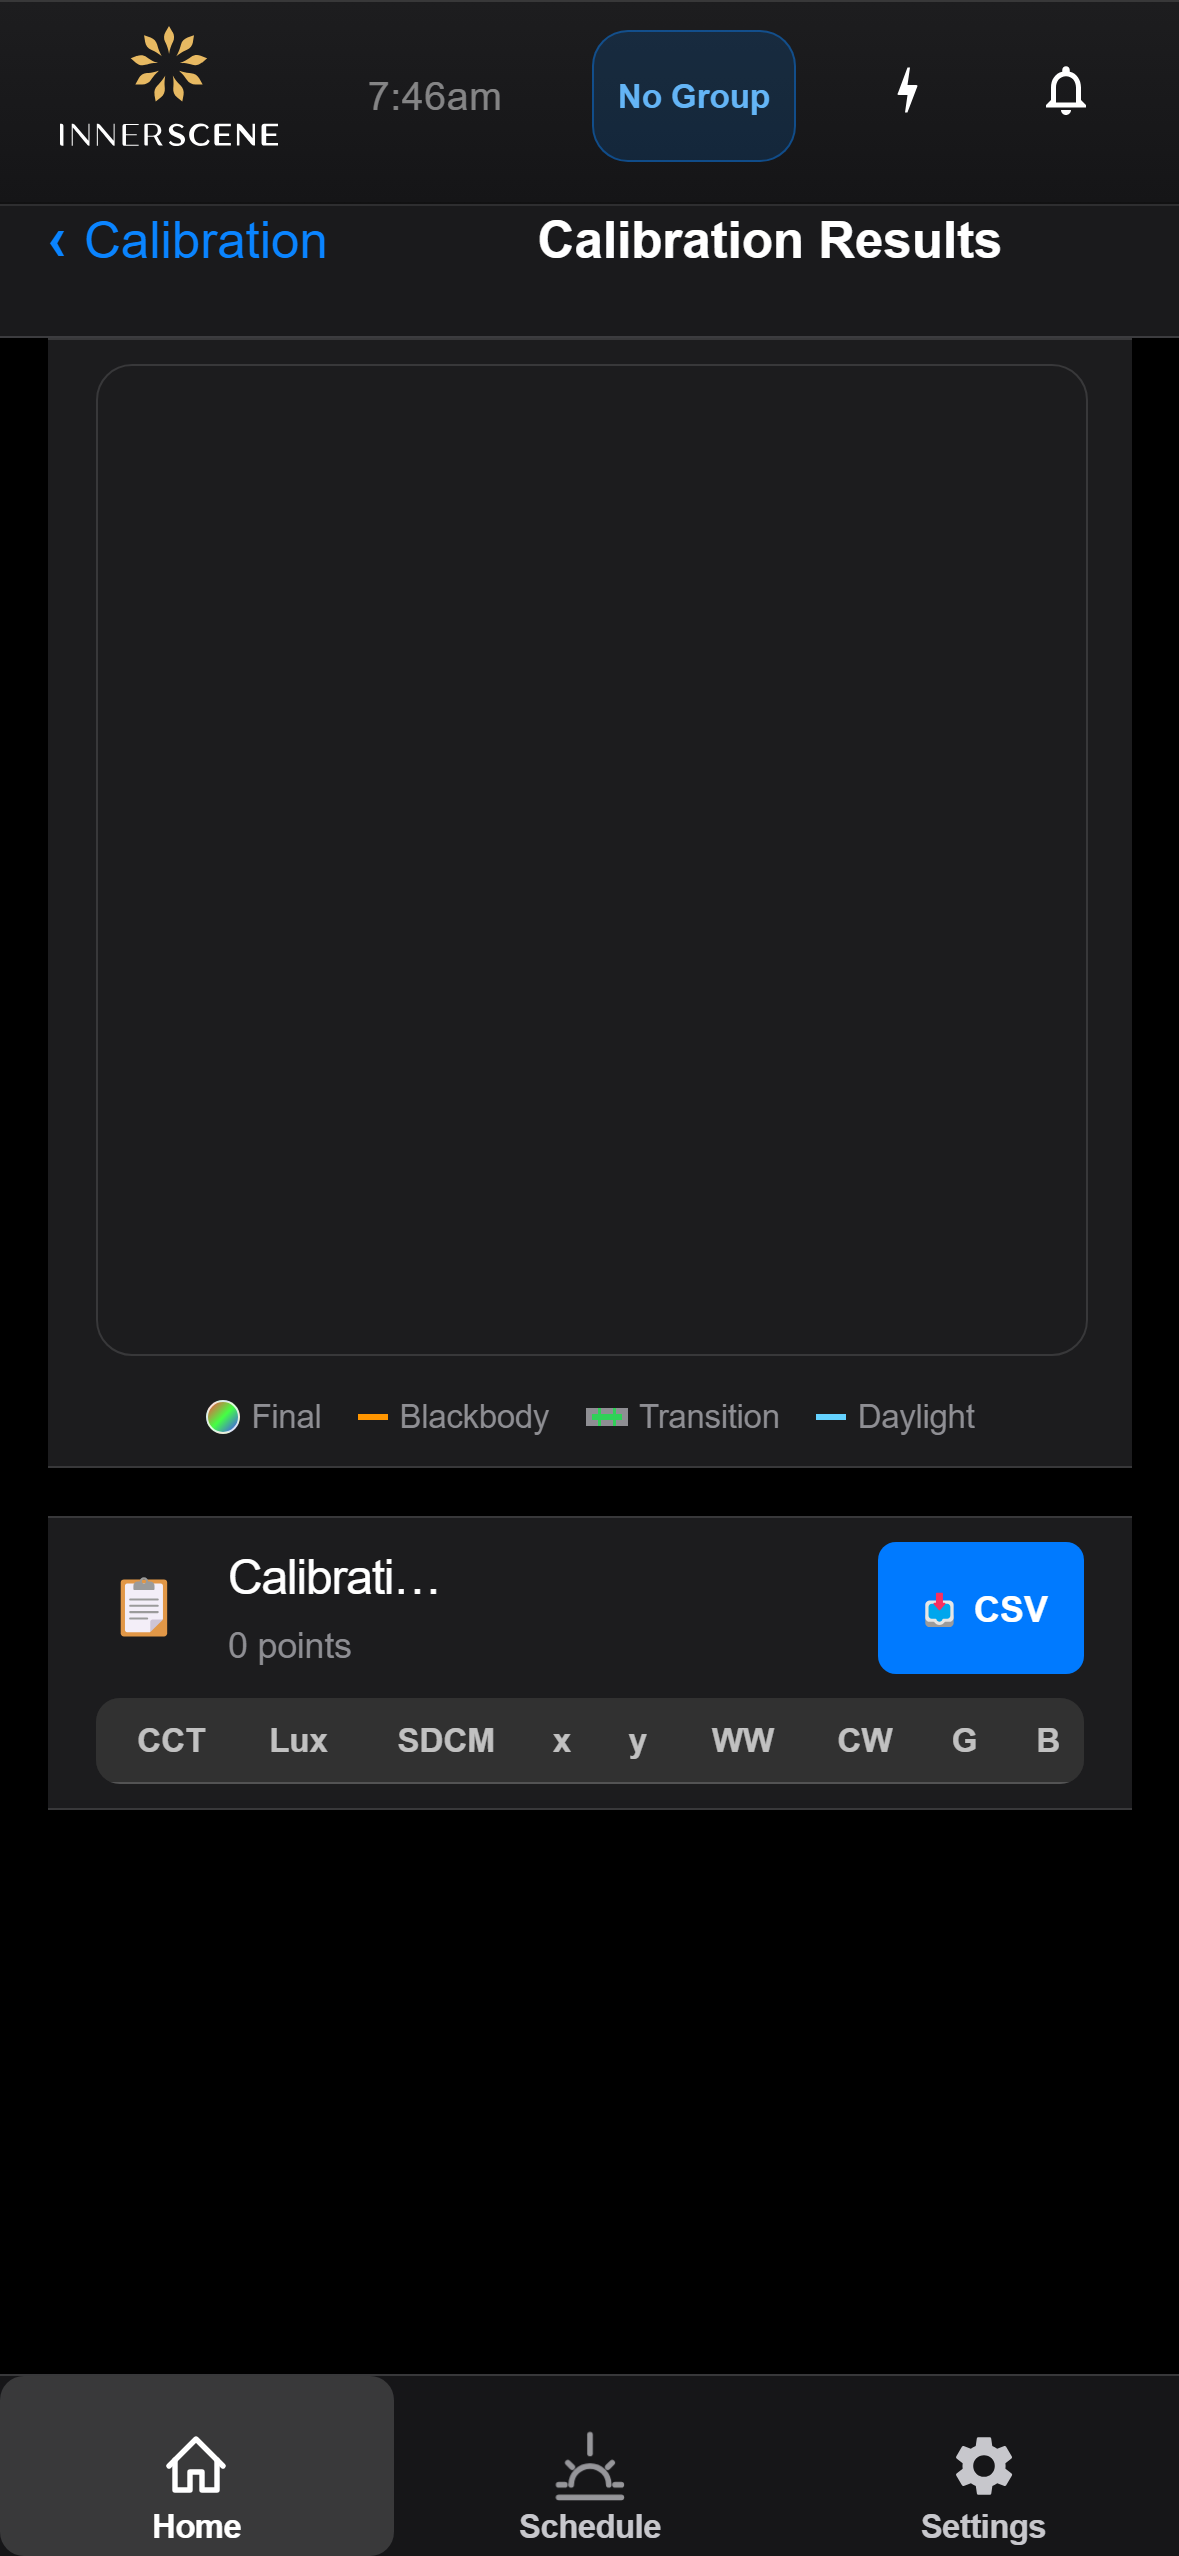
Shows the calibration results stored on the fixture: the individual calibration points plotted on a CIE 1931 chromaticity diagram, and the underlying point-by-point table including CCT, lux, color-MacAdam-step (SDCM), CIE xy coordinates, and raw LED channel values. Used to verify a fixture's calibration is healthy or to export the data for analysis.
Controls on this screen
- Calibration CIE Chart
Plots every calibration point on the CIE 1931 chromaticity diagram. The Planckian locus (orange) shows the blackbody curve, the transition (dashed green) and daylight (blue) lines mark the reference paths the fixture targets, and the calibration points themselves appear as small marks. Tight clustering on the reference curves indicates a clean calibration.
- Point Count
Number of calibration points stored on the fixture. A typical fixture has tens to hundreds of points depending on the calibration algorithm used.
- Download CSV
Exports the calibration table as a CSV file for offline analysis. Useful for comparing calibrations between fixtures, archiving a baseline, or feeding the data into external tools.
- Calibration Points Table
Per-point details of the calibration. Columns: target CCT (K), target illuminance (lux), color-quality SDCM (MacAdam step distance from target), measured CIE x and y, and the raw warm-white / cool-white / green / blue PWM values that produced the measurement. Scroll vertically to see all points.
Open this screen in the interactive guide to explore it with clickable callouts, search, and a live simulator, or browse all screens.